
Architecture Maturity
Architecture Maturity Assessment app is a tool to assess an organization’s architecture effectiveness using Architecture Maturity Model.
It evaluates the organization’s practices against the model to determine the level at which the organization currently stands. It indicates the organization’s ability to execute in the area concerned, and the practices on which the organization needs to focus in order to realize related business benefits.
The app assesses organization’s architecture characteristics and calculates a score to show the current maturity level. Each assessment can be stored separately and be retrieved for future reference. It is suitable for an organization to check its performance at regular interval for continuous improvement or for a consultant to keep track of assessments from various organizations.
There are 4 functions:
- Assess: to evaluate the current architecture maturity by measuring the architecture characteristics.
- Result: to show detail assessment result - the current state and recommendation for improvement in each architecture areas/characteristics.
- Chart: to show the radar chart of the assessment result.
- Compare: to compare up to 3 assessment results on a radar chart.
Assess
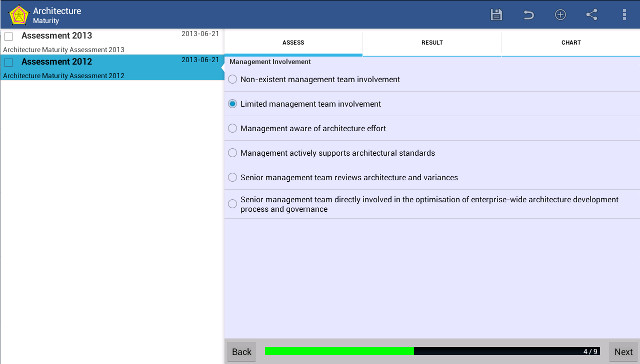
The Architecture Maturity Assessment model is adapted from the US Department of Commerce (DoC) IT Architecture Capability Maturity Model (ACMM).
It consists of six levels and nine architecture characteristics. Each characteristic is assessed and the results are consolidated to generate a maturity level.
The nine architecture characteristics are:
- Architecture Process
- Architecture Development
- Business Linkage
- Senior Management Involvement
- Operating Unit Participation
- Architecture Communication
- IT Security
- Governance
- IT Investment and Acquisition Strategy
Result
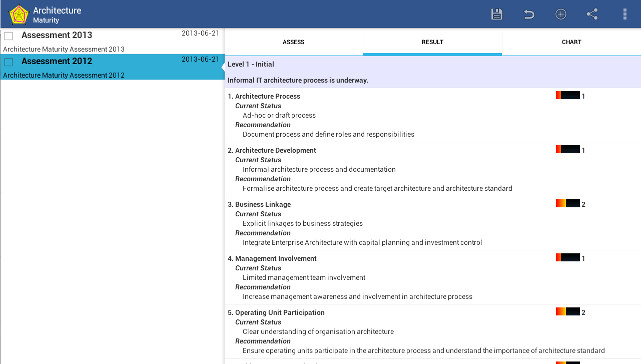
The Result tab shows the assessment results - the current state and recommendations for improvement in each architecture area.
The six maturity levels are:
- Level 0 - None
- Level 1 - Initial
- Level 2 - Under Development
- Level 3 - Defined
- Level 4 - Managed
- Level 5 - Optimizing
Chart
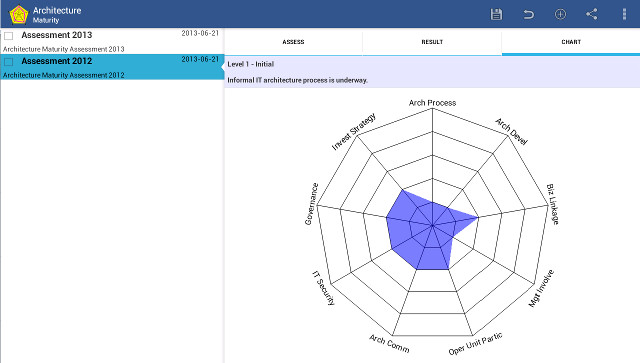
The Chart tab helps you visualize the assessment results by plotting on a radar chart.
A radar chart is useful for displaying observations of multi-dimensional data, and helps you visualize strengths/weaknesses or variation in maturity of different architecture characteristics.
Compare
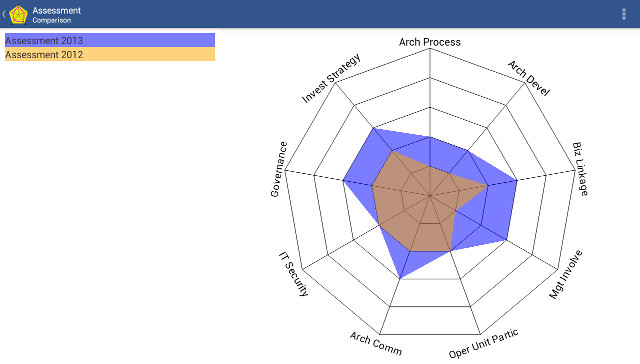
This allows you to compare 2-3 assessments and visualize using a radar chart, with each assessment represented by a different colour.
A radar chart is useful for displaying observations of multi-dimensional data, and you can compare:
- Your organization’s current and target maturity levels
- Your organization’s measured maturity levels over time
- Your organization’s maturity level against industry benchmarks
- Maturity levels of multiple organizations